
Upcoming Data Visualization Tools in 2021
-
Tableau
-
Databox
-
Zoho Analytics
-
Infogram
-
Datawrapper
-
Plotly
Big Data is the word your business can't compete without in the current competitive world. Big data helps track your profits, monitor the customer behavior, analyse trends and more in realtime. But the large collection of data won't be of any use if it isn't easy to read.
The high level executives can't decode the data while the coders can'y analyse it in the business sense. That makes data visualisation tools an important asset. These tools help marketers and scientists break down raw data and present them in a user-friendly way through graphics, videos, charts, graphs and more.
The human eye understands visuals better than text. Similarly, the human brain retains visuals longer. Hence, it's important for you to have a data visualisation tool whether you're working as a marketer, running your business or are a business intelligence student. It helps everyone trying to handle data. Here we list 6 data visualisation tools that are likely to rule the market in 2021.
Tableau

Tableau has revolutionized managing business data by offering exemplary visualisation and data analytics tools. Since Tableau us a free platform, you can enter the data manually or even import it in a spreadsheet.
You can absolutely create anything within this data visualization tool from a basic chart to interactive visualisation. It hence makes making presentations easier for data analysts.
Another reason why Tableau should be your preferred data visualisation tool in 2021 is that you can leverage the power of data from various sources and present it simply.
Databox
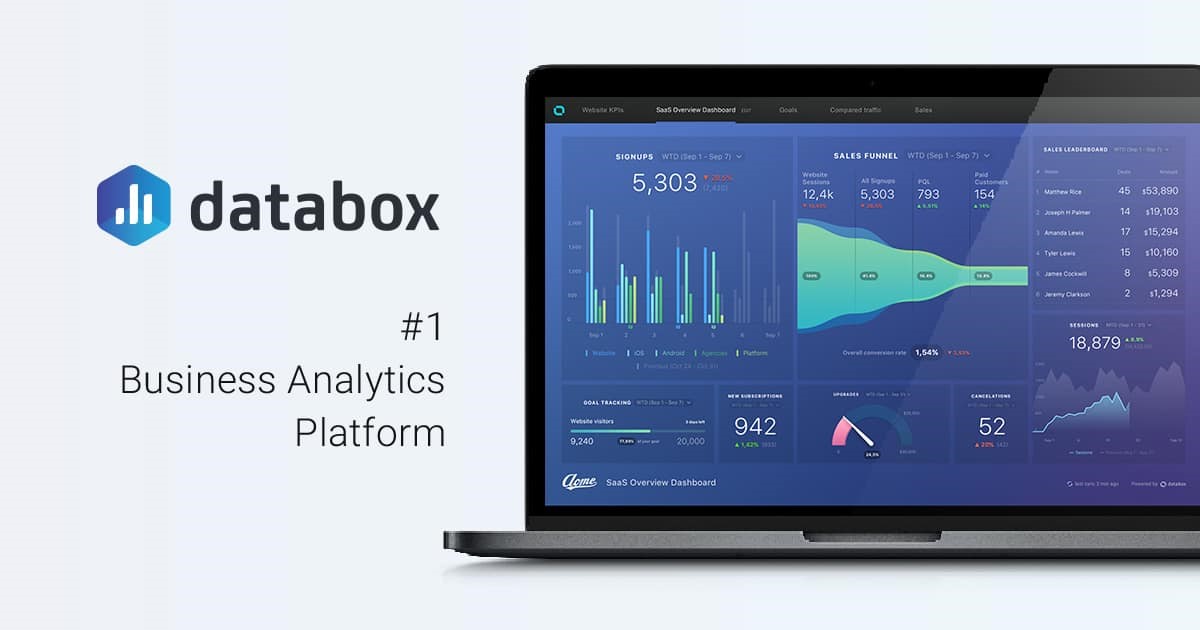
Over 15000 businesses have been using Databox data visualisation tool because of its ease of usage. Marketing agencies are finding it easy to quickly set up a dashboard within the app.
The tool doesn't require coding so you don't have to spend hours correcting one mistake and the other. It has more than 70 one-click integrations making it a delight, especially for large agencies.
The 200 pre-built reports in Databox cover it all from CRM to email performance, Google Ads, Analytics and more. You can also connect data from various tools like Github, Shopify, Hubspot etc. using this tool. It also offers a free version for 3 users so you can test it before buying.
Zoho Analytics
One of the oldest and most popular BI tools, Zoho is catering to MNCs and large companies like Bajaj, Maruti Suzuki, HDFC, HP and more. Data security is the priority of Zoho Analytics as testified by the usage of this tool by such huge corporates.
It allows you to cate various interactive charts, graphs, tables and components. That transforms the data into a concise form. It becomes easier to read and infer from the data in visually simple forms.
The dashboard of this tool is pretty intuitive and it also comes with stringent security policies. You will also get excellent support if you're a beginner just starting with it. You can also embed your reports to social media and share your achievements with your followers.
Infogram

The Infogram infographics and data visualisation tool allows you to create attractive maps, charts, and infographics using the information of the users. It created compelling graphics on its own without needing you to organize it
These graphics can be published as well as embedded and shared with the team and social media. The tool is popularly used by students and government bodies because of its compelling organization tools.
That goes without saying that Infogram doesn't require any technical knowledge of coding. An operator or your marketing executive can use this while carrying out other tasks easily. The price plans are pretty inexpensive and flexible based on the types you use. The tool is free if you just want it to use it for basic and personal designing and visualisation.
You can display your targets through charts and templates with this app. Hence it is popular among marketing and sales teams who need to share the demand and consumer trends.
You can add various colours, templates and fonts and a large variety of flags, images and icons in this tool. It has got a variety of maps and charts along with beautiful project templates that can make data visualisation a treat.
Datawrapper
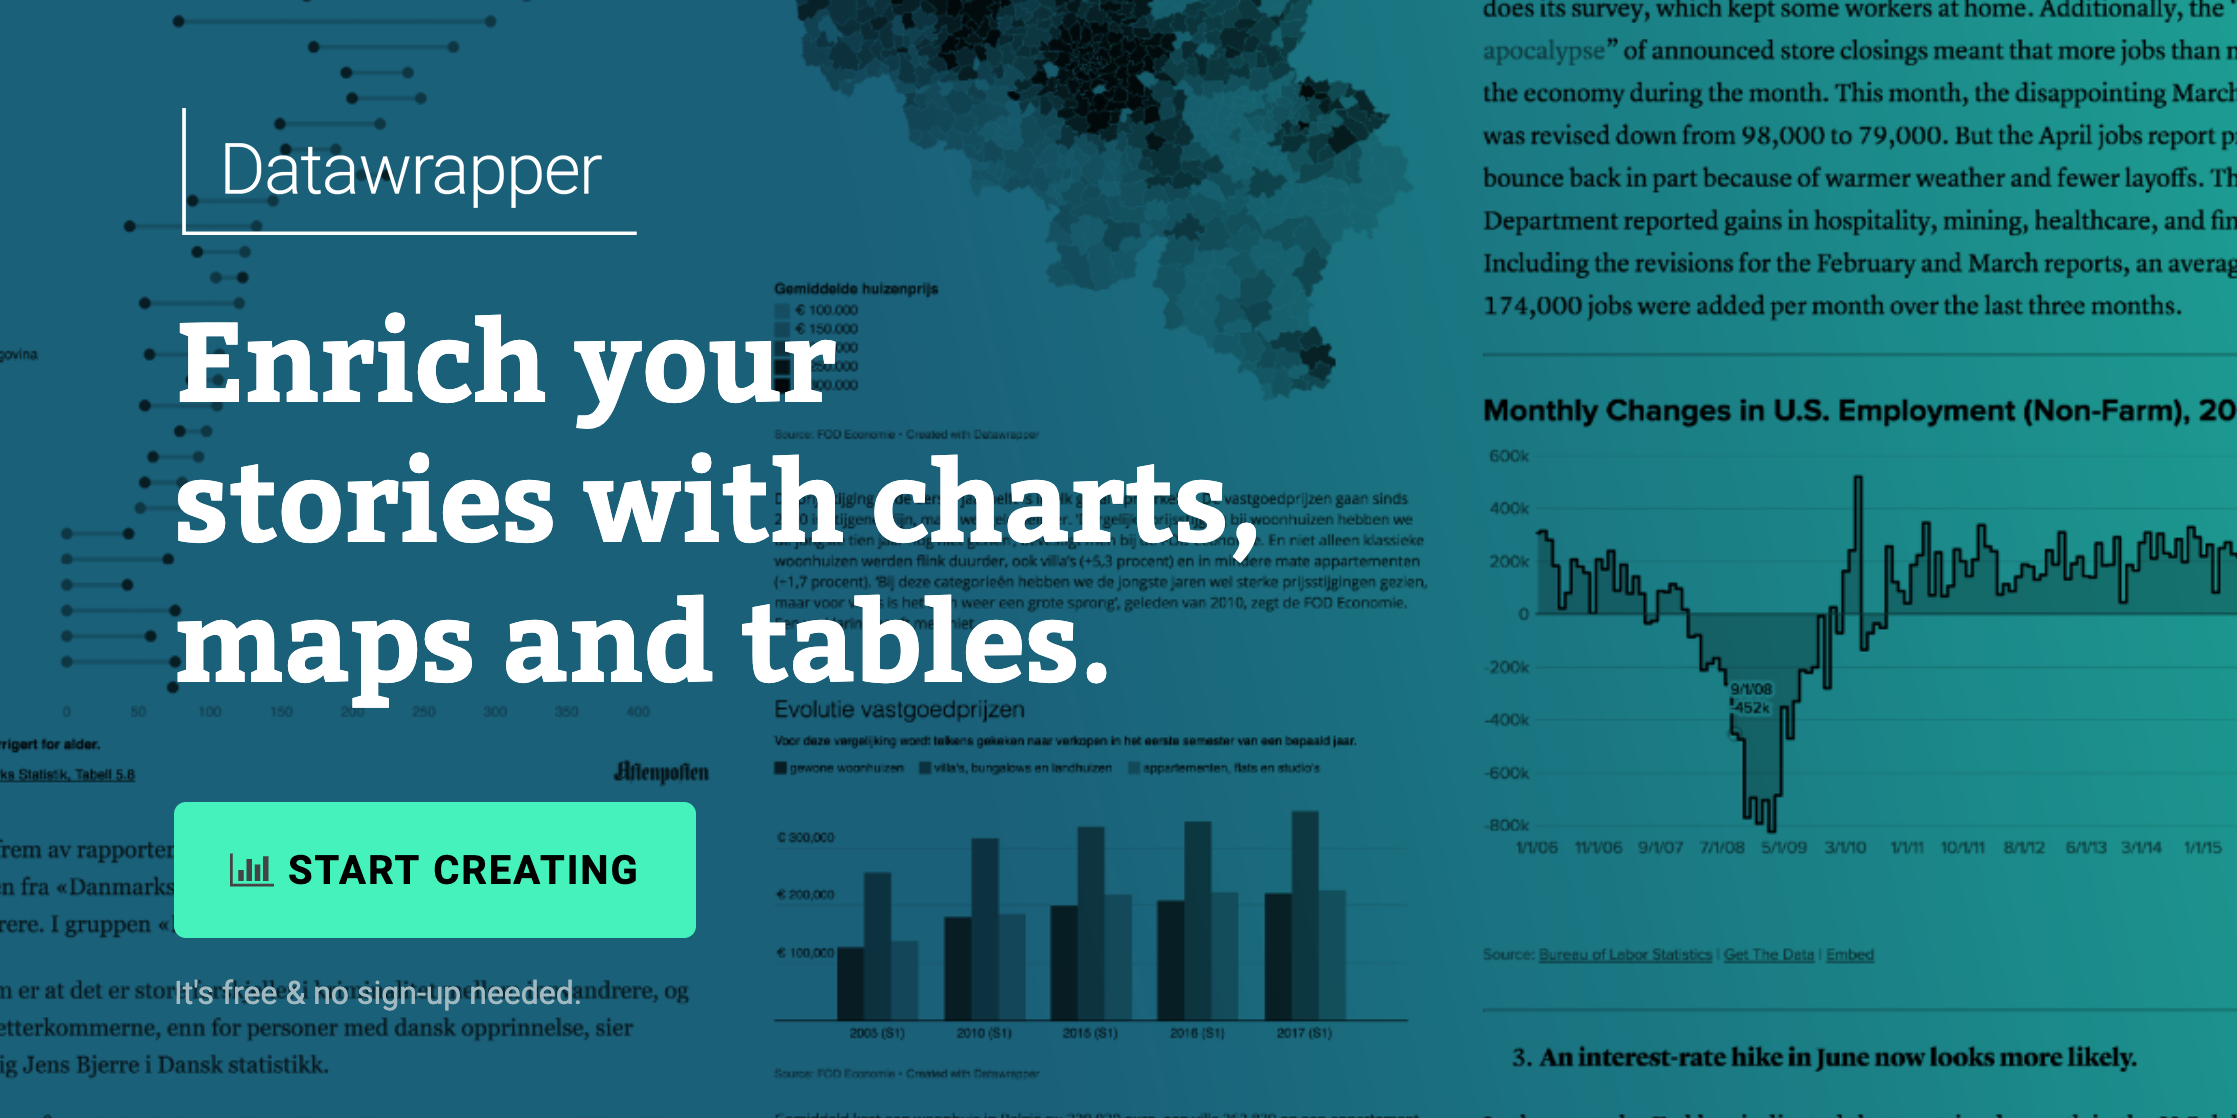
Another excellent data visualisation tool, Datawrapper software focuses on ease of display so that your audience gets each and every aspect of your presentation clearly. Gone are the days when you have to share excel screenshots around
They are difficult to read and take time to analyse. With Datawrapper, you can create a variety of visually appealing charts, maps and tables that are readable both in a PC as well as mobile.
You don't need to be an expert coder to use it either. This one is a non-commercial platform and thus suitable for students. Small organizations can also use its basic features and save the cost of buying software.
The open-source tool doesn't have any hidden charges either. It's operable with all kinds of operating systems and hence you can integrate the tool with various devices.
One of the drawbacks of using an open-source system like this is that your data will get stored on the server. It is hence not ideal if you are a large company and have confidential data to share within your team. The customization of fonts is also no up to the mark with this one.
Plotly
Plotly is as excellent in creating compelling graphics as it is in creating in-depth reports from complex forms of data. As a result, you will keep track of all your data using its user-friendly reports. Its interface is customizable and hence you can make it as per your liking
Exportation of reports is pretty smooth and easy with this software. People in the BI field would love getting their hands on it. It offers you commercial products like Dash Enterprise and Chart Studio and hence it's ideal for your commercial projects.
If you require a lot of AI and Data Science incorporated within your system, Plotly is the way to start. Small scale businesses and students would also benefit from the power it gives you.
You can now acquire solutions in multiple ways using the multi deployment options provided by Plotly. You can work as a team and add multiple teams members to keep the work-integrated and transparent.
The tool supports most popular languages including Python, R, and Node. It also provides custom dashboards and simulation modelling for better presentation and data analysis. The only drawback is the customer service which isn't available on phone.
Having one of these tools depending on your needs can not only help you make better decisions using the data but also save you a lot of time in data handling. Choose the beginner's plan and then change as you understand your needs.
Leave a comment
Your email address will not be published. Required fields are marked with *